USB Oscilloscope Software
FTDI drivers
This USB oscilloscope uses an FTDI USB chip. The drivers for this chip should be downloaded from the FTDI website and installed before connecting the oscilloscope for the first time. http://www.ftdichip.com/Drivers/CDM/CDM20814_Setup.exe (Windows 32 & 64 bit)
Download manual
If you are interested in the USB Scope hardware and/or software, you can download the manual by clicking on this link manual.pdf (you will need a pdf reader to open this manual.)
Download software
Click on this link usbscope.zip to download the software. After the downloads finishes, unzip the "usbscope.zip" file and run setup.exe. Follow the instructions which are displayed by the installation program.
Main program window
The screendump below shows the main UsbScope program window. The speedbuttons under the menu, allow for easy control of the main program
functions. From left to right :
- CLEAR traces
- SAVE measurement(s) to file
- STOP measurement
- START measurement
- LOOP measurement
- GAUGE (DVM, digital voltage meters)
- INFO of the used scope hardware
Digital Volt Meters (DVM)
The screendump below shows the digital volt meters. The update rate is approx. 2 Hz.
FFT result window
The screendump below shows the FFT calculation result window. The example shows the FFT of a 50 Hz square wave.
XY-plot window
The screendump below shows the XY plot window. In this window, channel 1 and channel 2 are plotted against eachother instead of plotting them against time. The animation shows 3 examples of 2 sine waves with 200 Hz frequency, each time shifted in phase. The screendump below shows the XY plot window with 2 sine waves plotted against eachother.

General setup
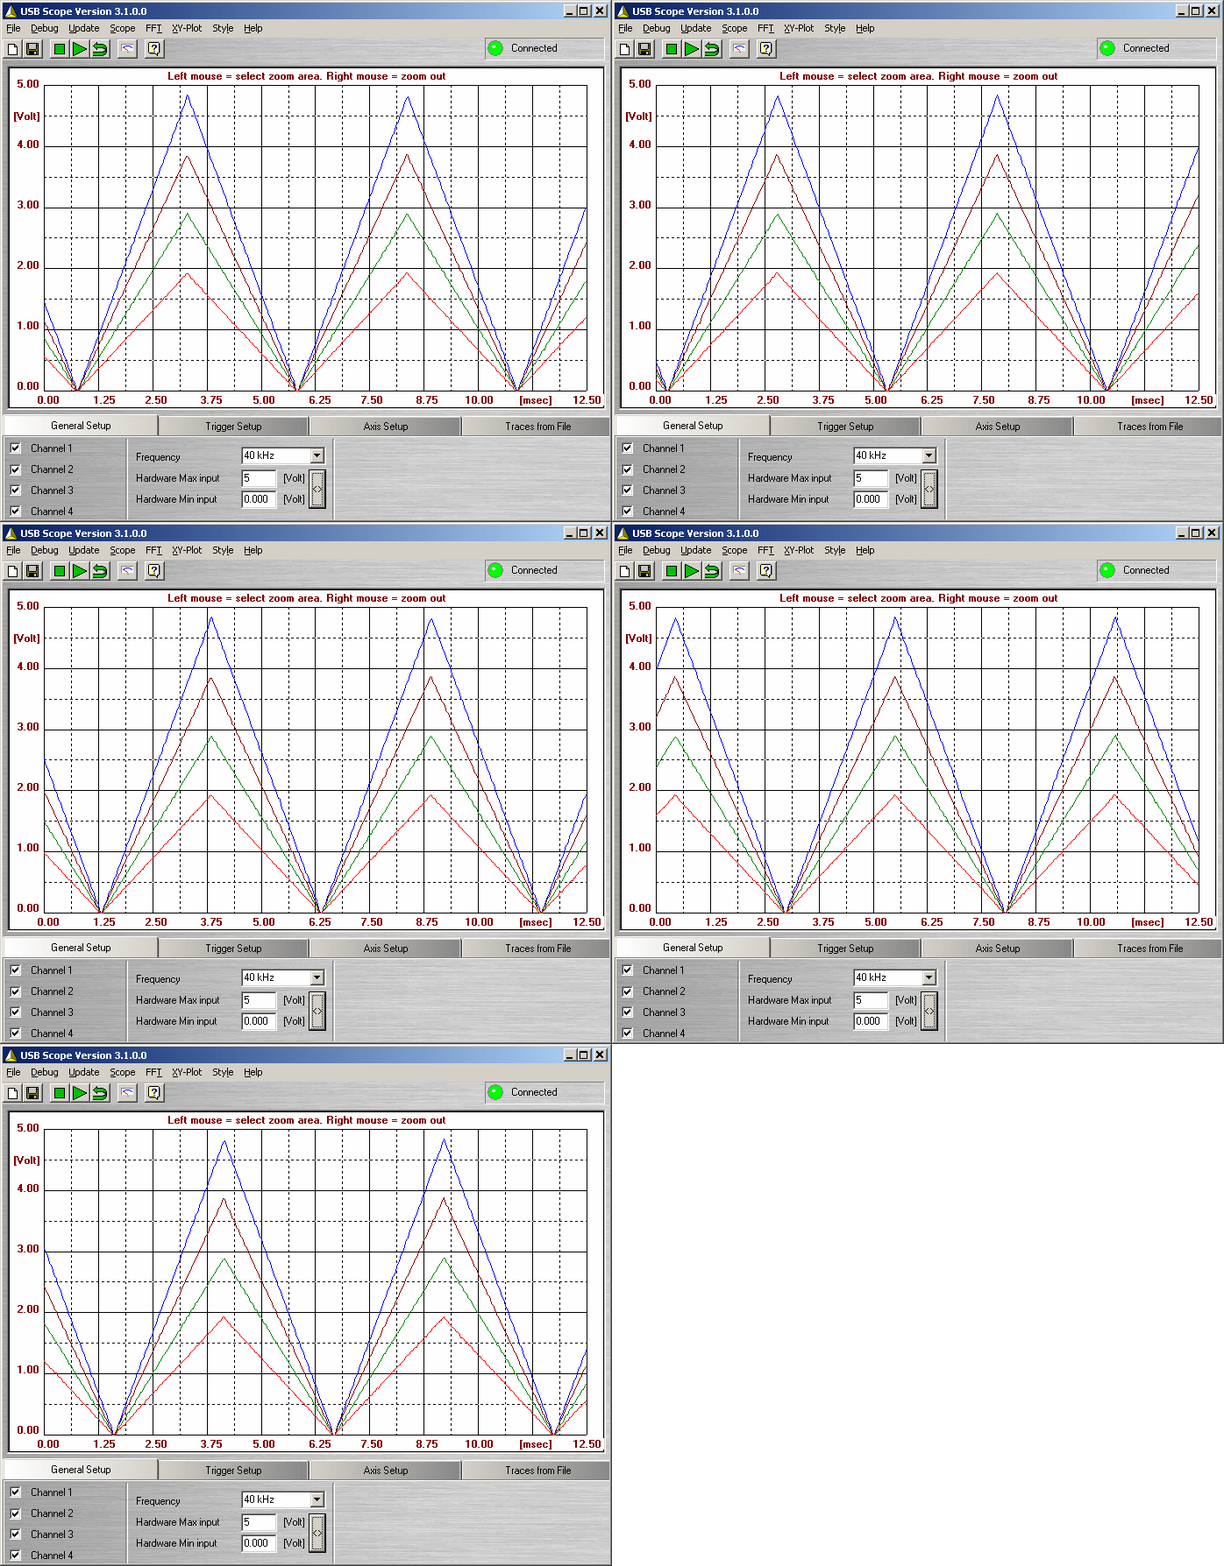
The screendump below shows the tab in which you can set the main program settings, like channels to display, sample frequency and hardware scaling (min, max input range). In this example, a 2 channel USB scope is connected which can do a 40 kHz sample rate. The input voltage range is set to 0V - 5V DC.
Trigger setup
The screendump below shows the options to setup the trigger function of the scope. Note: only channel 1 can be used to trigger. The trigger
level can be set using the edit-field and/or the up/down arrows. Trigger can be set on the rising or falling edge of the signal.

Axis scaling and measurement units
The sceendump below shows the options that used to set the correct labels along the axis and the correct scalings.

Loading previously stored measurements
The screendump below shows information about the files with saved measurements that were loaded. Each loaded file can be (de)-selected.

UsbLogger Software
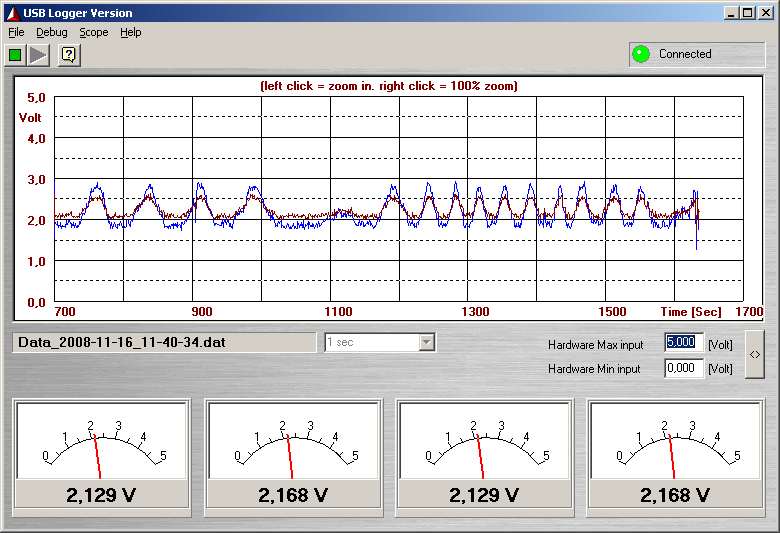
The screendump below shows the main UsbLogger program window.
The USB logger software makes it possible to do slow measurements (1 samples each second or slower) over very long periods. Ideal for logging slow processes like :
